Exploring The Mandelbrot Set With JavaScript
For this project we will render the Mandelbrot set onto an interactive HTML canvas using JavaScript. Before we begin, we will need to set up our development environment so that we can write and execute JavaScript.
Click On The Image Below To Zoom In
Set Up Your Development Environment
We will be using a text editor to type out our code, and a web browser to execute it.
Begin by creating a new file called mandelbrot.html. This is the file that will contain our JavaScript and HTML code.
After creating the file, open mandelbrot.html in a text editor and a web browser.
Type the following line of HTML into your text editor, save the file, and refresh your browser.
<h1>Hello World</h1>
If you have created and opened the mandelbrot.html file correctly, you will see Hello World displayed in your browser.
This means you have successfully set up your JavaScript development environment.
A Note On Complex Numbers
It is not possible to calculate the square root of a negative number, because any real number multiplied by itself will have a non-negative value. In other words x * x >= 0 is true for any real number x.
This problem is solved by using imaginary numbers. An imaginary number is written as a real number multiplied by i,
where i = -11/2. Let's take a look at the process for simplifying an imaginary number, the square root of -16, so that it is expressed as a real coefficient of i.
    -161/2 = 161/2 * -11/2
          = 4 * -11/2
          = 4i
A complex number is the sum of a real number and an imaginary number. The real number and imaginary number cannot be combined, so a complex number is written as a + bi
where a is a real number and bi is an imaginary number.
For example, if we add the real number 3 to the imaginary number -161/2
then the result would be the complex number 3 + 4i.
Plotting Complex Numbers
A complex number can be plotted in two dimensions using the horizontal axis as the real axis, and the vertical axis as the imaginary axis.
This means that we can plot a complex number a + bi with the real part a on the horizonal axis, and the imaginary part b on the vertical axis.
Effectively, (a, b) is plotted on the real and imaginary axes just like (x, y) is plotted on the x and y axes.
For example, the number 3 + 4i could be plotted in two dimensions like this:
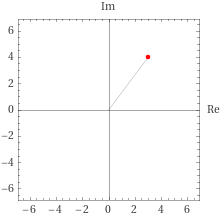
The length of the line connecting the origin 0 + 0i to the number 3 + 4i is a real number that is the absolute value of 3 + 4i.
We can use the Pythagorean theorem to find the length of this line, because we know the legs have lengths of 3 and 4i.
    |3 + 4i| = ( 32 + 42 )1/2
             = ( 9 + 16 )1/2
             = 251/2
             = 5
What is the Mandelbrot set?
According to Wikipedia:
- The Mandelbrot set is the set of complex numbers
Cfor which the functionfc(z) = Z2 + Cdoes not diverge to infinity when iterated fromz = 0, i.e., for which the sequencefc(0),fc(fc(0)), etc., remains bounded in absolute value. - The Mandelbrot set is closed and contained in the closed disk of radius
2around the origin.
What Does That Mean?
This definition can look intimidating at a glance, but it is actually easy to understand. First, let's re-write the function fc(z) = Z2 + C
so that it represents a sequence of numbers: Zn+1 = Zn2 + Z0.
Every number in the sequence is equal to the previous number squared plus the first number in the sequence.
In this sequence, n represents the number of iterations, Zn is the value of Z after n iterations of the sequence, and
Z0 is the number we use to initialize the sequence.
Evaluating whether or not this sequence has a limit will tell us if Z0 is in the Mandelbrot set.
Evaluating The Sequence
We will evaluate the sequence Zn+1 = Zn2 + Z0 by defining an arbitrary number of iterations, and defining an arbitrary limit for |Zn|.
Then we will check if |Zn| exceeds our limit after our set number of iterations.
For example, let's assume that our limit is 2 and we are testing 10 iterations.
If |Zn| exceeds 2 after 10 iterations of the sequence, then we will assume that the sequence is divergent, and the number Z0 that initialized the sequence is not in the Mandelbrot set.
Conversely, if |Zn| does not exceed 2 after 10 iterations of the sequence, then we will assume that the sequence has a limit and is convergent. This means the number Z0 that initialized the sequence is in the Mandelbrot set.
We will render the Mandelbrot set by iterating through every pixel of our canvas, and using the process described above to determine if the complex number a + bi that represents the pixel's coordinates is in the Mandelbrot set. If it is then we will color the pixel on our image.
That Sounds Like A Game Of Battleship
The process we'll use to color pixels is almost like a game of Battleship.
To play Battleship, one player guesses a pair of coordinates, then the opposing player determines if the coordinates are a Hit or a Miss, and relays the Hit or Miss response back to the first player. If it was a Hit then the first player marks the coordinates on a grid.
Similarly, our script will use the coordinates of a pixel on the canvas represented as a complex number Z0 as its guess, then a function will act like a Battleship opponenet and return true if Z0 was a Hit (i.e. if Z0 is in the Mandelbrot set).
If the function returns true then we will color the pixel that was represented by the number Z0.
Let's See An Example
For simplicity's sake, we will start by using real numbers in our examples. Real numbers are all plotted on the horizontal axis (the real axis) because the coefficient of i is 0. Any real number x is equivelant to the complex number x + 0i.
We'll start with Z0 = 1, and create a chart of the values we expect for Zn for the first five iterations of Zn+1 = Zn2 + Z0.
From this chart, we can see that |Zn|
becomes greater than 2 after a couple of iterations. Therefore Z0 is not part of the Mandelbrot set.
| n | Zn | calculation |
|---|---|---|
| 0 | 1 | |
| 1 | 2 | 12 + 1 |
| 2 | 5 | 22 + 1 |
| 3 | 26 | 52 + 1 |
| 4 | 677 | 262 + 1 |
| 5 | 458330 | 6772 + 1 |
Let's look at another example using Z0 = -1, and create a chart of the first five iterations.
From this chart, it looks like |Zn| will never be greater than 2. Therefore we can not exclude Z0 from the Mandelbrot set.
| n | Zn | calculation |
|---|---|---|
| 0 | -1 | |
| 1 | 0 | -12 + -1 |
| 2 | -1 | 02 + -1 |
| 3 | 0 | -12 + -1 |
| 4 | -1 | 02 + -1 |
| 5 | 0 | -12 + -1 |
In fact, we can say with certainty that Z0 is part of the Mandelbrot set because Z0 == Zn is true for a non-zero value of n, but our script will not make this distinction.
Visual Examples
The plot below shows a circle of radius 2 around the origin. This circle represents the limit of 2 that we set for |Zn|.
The values of Zn for the first 4 iterations of Zn+1 = Zn2 + Z0 where Z0 = 0.5 are plotted on the graph, and you can see that |Zn| is greater than 2 when n = 4
so we can assume that the sequence diverges to infinity. This means that Z0 is not in the Mandelbrot set.
In the example below, we can see that Zn converges on a limit that is less than 2 when Z0 = 0.25. Therefore we can assume that Z0 is in the mandelbrot set.
Iterating With JavaScript
Begin by adding opening and closing script tags to your HTML file. This is where our JavaScript will be written.
<script></script>
Next, add the following for loop between the opening and closing script tags to iterate through the sequence Zn+1 = Zn2 + Z0 ten times starting with Z0 = 1
  <script>
      var z_sub0 = 1;
      var z_subn = z_sub0;
      var iterations = 10;

      for(var n = 0; n < iterations; n++) {
          console.log(n, z_subn);
          z_subn = z_subn*z_subn + z_sub0;
      }
  </script>
Save the HTML file, refresh your browser, and inspect the console. You should see output that looks very similar to our previous calculations:
    0 1
    1 2
    2 5
    3 26
    4 677
    5 458330
    6 210066388901
    7 4.4127887745906175e+22
    8 1.9472704769152963e+45
    9 3.7918623102659254e+90
Next, let's run our script using Z0 = -0.25 and see if |Zn| ever exceeds 2. To do this, we just need to change the first line of our JavaScript from
var z_sub0 = 1; to var z_sub0 = -0.25;. After That, the output of the first ten iterations should look like this:
    0 -0.25
    1 -0.1875
    2 -0.21484375
    3 -0.2038421630859375
    4 -0.20844837254844606
    5 -0.20654927598190423
    6 -0.20733739659135117
    7 -0.20701120397472075
    8 -0.20714636142893655
    9 -0.2070903849467524
We can't be certain yet, but so far |Zn| has not exceeded 2, so the number -0.25 + 0i could be part of the Mandelbrot set.
Write a JavaScript Function
Our loop seems to iterate correctly through the sequence Zn+1 = Zn2 + Z0, but it isn't very useful yet
because we need to change the initial value of var z every time we run it.
We can solve this problem by putting our for loop into a function. We can call the function using different values for Z0 each time.
  <script>
      function is_mandelbrot(z_sub0) {
          var z_subn = z_sub0;
          var iterations = 10;
          for(var n = 0; n < iterations; n++) {
              console.log(n, z_subn);
              z_subn = z_subn*z_subn + z_sub0;
          }
      }

      is_mandelbrot(1);
      is_mandelbrot(-0.25);
  </script>
Looking at the script above, you can see that our for loop is moved inside a function called is_mandelbrot.
The function accepts one argument, z_sub0, and iterates through the sequence ten times using z_sub0 as Z0.
After saving our script, refreshing the browser, and inspecting the console, we can see that our function displays
Zn for ten iterations using the initial value of Z0 = 1 when it is called as is_mandelbrot(1);,
and then displays ten more iterations using the initial value of Z0 = -0.25 when it is called as is_mandelbrot(-0.25);
A More Useful Function
Our function has made the loop more useful, but it is still just printing the sequence to the console. It is not returning any information.
So let's return false; at the end of the function if |Zn| is ever greater than 2, and return true; if |Zn| stays under 2.
We'll also add a condition to our for loop so that it stops iterating when |Zn| > 2. This will significantly reduce processing time when we check every pixel on the canvas.
This is a good time to reconsider where in our script we should declare the variable iterations. Currently, the variable is declared inside of our is_mandelbrot function,
but this is not necessary or ideal. Let's move the line var iterations = 10; outside of the loop, to the top of the script.
  <script>
      var iterations = 10;

      function is_mandelbrot(z_sub0) {
          var z_subn = z_sub0;
          for(var n = 0; n < iterations && Math.abs(z_subn) < 2 ; n++) {
              z_subn = z_subn*z_subn + z_sub0;
          }
          return (Math.abs(z_subn) < 2);
      }

      console.log( is_mandelbrot(1) );
      console.log( is_mandelbrot(-0.25) );
  </script>
What About Complex Numbers?
So far our script only works for real numbers. We want it to work for complex numbers so that we can plot points beyond the real axis. We will need to change how we add, square, and calculate absolute values to make our script compatible with complex numbers.
We will do this by writing our own functions to perform these operations, and calling the functions at the appropriate place in our script.
  <script>
      var iterations = 10;

      function square_val(num) {
          return num*num;
      }

      function abs_val(num) {
          return Math.pow(square_val(num), 0.5);
      }

      function add_vals(num1, num2) {
          return num1 + num2;
      }

      function is_mandelbrot(z_sub0) {
          var z_subn = z_sub0;
          for(var n = 0; n < iterations && abs_val(z_subn) < 2 ; n++) {
              z_subn = add_vals(square_val(z_subn), z_sub0);
          }
          return (abs_val(z_subn) < 2);
      }

      console.log( is_mandelbrot(1) );
      console.log( is_mandelbrot(-0.25) );
  </script>
Now that we've factored the arithmetic operations into their own functions, we will change them to use complex numbers. But before we can do that we need to decide how we will express complex numbers, because they are not a JavaScript data type.
Let's use an array of two real numbers to represent a single complex number.
The first number in the array is the real part of the complex number and the second number is the coefficient of i.
For example, the JavaScript array [2, 3] would represent the complex number 2 + 3i
Squaring Complex Numbers
Let's take a look at the process for squaring a complex number.
    (a + bi)2 = (a + bi)(a + bi)
              = a2 + abi + abi + bi2
              = a2 - b2 + 2abi
From this example, we can see that after squaring a complex number, the real part is a2 - b2
and the imaginary part is 2*a*b. We can modify our square_val function to work this way, like in the following example.
   function square_val([a, b]) {
       return [a * a - b * b, 2 * a * b];
   }
Calulating Absolute Values
The absolute value of a number is its distance from 0. Real numbers can all be plotted on a number line where their distances from 0
are simply their unsigned values.
We can calculate the distance from 0 for a complex number plotted at point (a, b) the same way we would calculate it for a point (x, y). This is done
by using the Pythagorean theorem to find the length of a hypotenuse when legs have lengths of a and b.
Let's re-write our abs_val function so that it uses this calculation for absolute values |a + bi| = (a2 + b2)1/2.
   function abs_val([a, b]) {
       return Math.pow((Math.pow(a,2) + Math.pow(b,2)), 0.5);
   }
Summing Complex Numbers
Adding two complex numbers together is a pretty straightforward process. To find the sum of two complex numbers, first add the real parts together and then add the imaginary parts. That's all there is to it.
Let's re-write our add_vals function so that it works this way.
   function add_vals([a1, b1], [a2, b2]) {
       return [a1 + a2, b1 + b2];
   }
Testing The Script
Now that we've changed our script to use complex numbers, we can call the is_mandelbrot function using an array formatted like [a, b]
to check if the number a + bi is in the Mandelbrot set. If it is not in the set then is_mandelbrot will return false. If the number
could be in the Mandelbrot set, then is_mandelbrot will return true.
It is worth noting that our process can determine with certainty that a number is excluded from the Mandelbrot set, but even when is_mandelbrot returns true
we are not certain that the number is included in the set.
When is_mandelbrot returns true, it just means that the number was not found to be excluded from the set
after our arbitrary number of iterations. The logic here is similar to a jury seeing evidence and then deciding between "guilty" and "not guilty" verdicts, without considering if a defendant is "innocent".
Without further ado, let's try calling our is_mandelbrot function with complex numbers, and logging the output to the console.
   console.log( is_mandelbrot([1, 0]) );
   console.log( is_mandelbrot([-0.25, 0]) );
   console.log( is_mandelbrot([1, 0.25]) );
   console.log( is_mandelbrot([0, 0.25]) );
After calling our function four times with the numbers above, the output should be:
   false
   true
   false
   true
Pi Ex Machina
The Mandelbrot set has some interesting properties, and one of them is that pi manifests in the limits.
When a = -0.75, then as b approaches 0, b*n approaches pi, where n is the number of iterations it takes before |Zn| > 2.
   var iterations = 1000000;

   // ...

   function is_mandelbrot(z_sub0) {
       var z_subn = z_sub0;
       for(var n = 0; n < iterations && abs_val(z_subn) < 2 ; n++) {
           z_subn = add_vals(square_val(z_subn), z_sub0);
       }
       return n;
   }

   pi = is_mandelbrot([-0.75, 0.00001]) * 0.00001;
   console.log(pi);
If we temporarily modify our script like the example above to test a million iterations var iterations = 1000000;, and return n when |Zn| > 2,
then we can call is_mandelbrot using a = -0.75 and b = 0.00001 and estimate pi by multiplying n and b.
The output should be 3.1415900000000003. The extra 3x10-16 is the result of using floating point data types.
Why 2?
At this point you may be wondering why we use the limit of 2 to evaluate whether or not a sequence is bounded. This limit is called the escape radius, rmax, and it is equal to the greatest |Zn| of any sequence for any number in the set,
i.e. rmax = max{|Zn|} where Z0 is any number in the Mandelbrot set.
If we evaluate the sequence for -2 + 0i, we can see that it converges on 2 after a single iteration. This is the greatest |Zn| of any number in the set and therefore rmax = 2.
Recall from our Wikipedia definition that every number in the Mandelbrot set is "contained in the closed disk of radius 2 around the origin."
On the complex plane, a closed disk of radius 2 around the origin has a domain of (-2, 2) and a range of (-2i, 2i).
Because of this, we will initially plot the set on a square canvas where both the horizontal and vertical axes have lengths of 4.
How Many Iterations?
Using a higher number of iterations will give us more confidence that the points we are plotting are actually in the Mandelbrot set, and when rendering the set onto an HTML canvas element, we will plot fewer incorrect points by using a higher number of iterations. However, using more iterations will take more processing time.
It is up to you how many iterations you will use, but somewhere between 10 and 100 would be a good starting point.
Adding The HTML Canvas Element
So far we have been displaying our script's output on the console using console.log(). In order to render the Mandelbrot set as an image,
we will need a way to plot numbers after we check them with the is_mandelbrot function. One way to do this is by using an HTML canvas.
We will set the canvas's width and height in pixels by using JavaScript, and then plot the Mandelbrot set by coloring the pixels one by one.
Add a canvas element above the script tags by using the following line of HTML:
<canvas id="mandelbrotCanvas"></canvas>
When we include this HTML element in our document, we set the id attribute so that our script can find the element.
Using JavaScript To Change The HTML Canvas
Before we can start plotting points on our canvas, we need to set a few variables in JavaScript
so that our script can interact with the canvas element. We will do this by assigning the canvas element to the variable canvas
with the line var canvas = document.getElementById('mandelbrotCanvas');.
After we have declared the variable canvas
we will assign a drawing context instance for canvas to the variable ctx using the line var ctx = canvas.getContext('2d');.
Add the following code to your script to set these variables and a few others.
     var canvasWidth = 400;
     var canvasHeight = 400;
     var axisLength = 4;
     var canvas = document.getElementById('mandelbrotCanvas');
     canvas.width = canvasWidth;
     canvas.height = canvasHeight;
     var ctx = canvas.getContext('2d');
     ctx.fillStyle = "blue";
Now we can color any pixel on our 400x400 canvas blue using the line ctx.fillRect(col, row, 1, 1);
where col is an integer between 0 and 399 that indicates the column of the pixel, from left to right on our canvas,
and row is an integer between 0 and 399 that indicates the row of the pixel, from top to bottom on our canvas.
Where Is The Origin?
We will need to work with two different coordinate systems to render the Mandelbrot set.
When we use ctx to reference the column and row of a pixel on our canvas, then (0, 0) is the pixel in the top left corner, and (canvasWidth-1, canvasHeight-1) is the pixel in the bottom right corner.
When we plot complex numbers, we'll use a coordinate pair (a, b) to represent a number a + bi. Then we will assume that the origin (0, 0) is in the middle of the canvas, and that both the real and imaginary axes have lengths of axisLength.
This would give the pixel in the top left corner the coordinates (-axisLength/2, axisLength/2), and the pixel in the bottom right corner would be (axisLength/2, -axisLength/2).
Because of these differences, we will need to convert a pixel's coordinates from (col, row) to (a, b) so that it can be evaluated.
Converting Coordinates
Before evaluating each pixel, we will convert our horizontal coordinate from col to a with this line:
a = (col-(canvasWidth/2)) * (axisLength/canvasWidth);And we will convert our vertical coordinate from row to b with this one:
b = ((canvasHeight/2)-row) * (axisLength/canvasHeight);The first factor (col-(canvasWidth/2)) accounts for the different origin positions in our coordinate systems, and the second factor
(axisLength/canvasWidth) accounts for the differences in height or width.
You might have noticed that col is positive, but row is negative. This is to account for the fact that the row number of a pixel
row increases as it moves down the canvas, but the imaginary part of a complex number b decreases as it moves down the canvas.
Iterating Over Each Pixel
If we think of our 400x400 canvas as a 2-dimensional array, then the simplest way to iterate over every pixel is by using two nested loops.
The most intuitive direction to iterate through these pixels is from left to right and top to bottom, so our outer loop will iterate over row numbers, and our inner loop will iterate over column numbers:
     for(var row = 0; row < canvasHeight; row++) {
         for(var col = 0; col < canvasWidth; col++) {
             // We will evaluate and color pixels here
         }
     }
That's the last piece of the puzzle. Now we just need to put our script together and execute it in the browser.
It could also be helpful to add the line console.log(row/canvasHeight*100, '%'); to the outer loop so that the progress is logged to the console.
After adding the logic described above, our script will include a function to convert coordinates, like the following example:
     function convert_coords([col, row]) {
         return [
            (col-(canvasWidth/2)) * (axisLength/canvasWidth),
            ((canvasHeight/2)-row) * (axisLength/canvasHeight)
        ];
     }

     for(var row = 0; row < canvasHeight; row++) {
         for(var col = 0; col < canvasWidth; col++) {
             var x = convert_coords([col, row]);
             if( is_mandelbrot(x) ) {
                 ctx.fillRect(col, row, 1, 1);
             }
         }
         console.log(row/canvasHeight*100, '%');
     }
Rendering The Mandelbrot Set
After connecting all the dots, your mandelbrot.html document should look something like the example below.
You can change the iterations, canvasWidth, canvasHeight, and axisLength to render the set with different resolutions and domains.
Make any changes you want, save the file, and refresh your browser. Congratulations, you have rendered the Mandelbrot set.
    <canvas id="mandelbrotCanvas"></canvas>
    <script>
        var iterations = 100;
        var canvasWidth = 400;
        var canvasHeight = 400;
        var axisLength = 4;

        var canvas = document.getElementById('mandelbrotCanvas');
        canvas.width = canvasWidth;
        canvas.height = canvasHeight;

        var ctx = canvas.getContext('2d');
        ctx.fillStyle = "blue";

        function square_val([a, b]) {
            return [a * a - b * b, 2 * a * b];
        }

        function abs_val([a, b]) {
            return Math.pow((Math.pow(a,2) + Math.pow(b,2)), 0.5);
        }

        function add_vals([a1, b1], [a2, b2]) {
            return [a1 + a2, b1 + b2];
        }

        function is_mandelbrot(z_sub0) {
            var z_subn = z_sub0;
            for(var n = 0; n < iterations && abs_val(z_subn) < 2 ; n++) {
                z_subn = add_vals(square_val(z_subn), z_sub0);
            }
            return (abs_val(z_subn) < 2);
        }

        function convert_coords([col, row]) {
            return [
               (col-(canvasWidth/2)) * (axisLength/canvasWidth),
               ((canvasHeight/2)-row) * (axisLength/canvasHeight)
           ];
        }

        for(var row = 0; row < canvasHeight; row++) {
            for(var col = 0; col < canvasWidth; col++) {
                var x = convert_coords([col, row]);
                if( is_mandelbrot(x) ) {
                    ctx.fillRect(col, row, 1, 1);
                }
            }
            console.log(row/canvasHeight*100, '%');
        }
    </script>
Adding Color
When we render the Mandelbrot set using the script above, it only has two colors. The canvas is white by default, and then we color each pixel blue with ctx.fillStyle = "blue"; if the pixel is not excluded from the set.
Using more than one color, or a color gradient, will make our rendering more interesting to look at. A common way to incorporate color into Mandelbrot renderings is by shading each pixel that we exclude from the set based on the number of iterations n
it took for |Zn| to exceed 2.
To do this, we will use the hsla() color format and adjust the lightness based on the percentage of iterations it takes for |Zn| to exceed 2.
For example, if iterations = 10 and we evaluate the number 0.5 + 0i, it will take 4 iterations for |Zn| to exceed 2, so we would set the lightness of the point (0.5, 0) to 40%.
If n == iterations is true then we will leave the pixel white and assume it is in the Mandelbrot set.
The hsla() color format defines a color using four parameters: hue, saturation, lightness, and alpha. We are using 240 for a blue hue, 100% saturation, dynamic lightness, and no transparency so alpha is set to 1.
There are a lot of interesting ways we can combine variables in our
script to manipulate the hsla() color. For example, the hue could change depending on the column of a pixel using something like Math.floor(col/canvasWidth*360).
First let's change our is_mandelbrot function so that it returns the number of iterations n instead of a boolean value.
    function is_mandelbrot(z_sub0) {
        var z_subn = z_sub0;
        for(var n = 0; n < iterations && abs_val(z_subn) < 2 ; n++) {
            z_subn = add_vals(square_val(z_subn), z_sub0);
        }
        return n;
    }
Next, we'll create a new function called color_pixel that will accept the number of iterations n and the pixel's coordinates (c, r) as arguments. Then it will use this information to determine how to color the pixel, as described above.
    function color_pixel(n, [col, row]) {
        if( n != iterations ) {
            var iterationPercent = n / iterations * 100;
            ctx.fillStyle = 'hsla(240, 100%, ' + iterationPercent + '%, 1)';
            ctx.fillRect(col, row, 1, 1);
        }
    }
We'll also need to call color_pixel from inside of our for loops.
    for(var row = 0; row < canvasHeight; row++) {
        for(var col = 0; col < canvasWidth; col++) {
            var x = convert_coords([col, row]);
            color_pixel(is_mandelbrot(x), [col, row]);
        }
        console.log(row/canvasHeight*100, '%');
    }
Zooming In
If you decrease the axisLength variable and run our script, then the domain and range of our plot will be reduced,
making the canvas zoom in on the number 0 + 0i, or (0, 0). Increasing the axisLength variable will have the opposite effect.
Moving The Center Point Of The Plot
Below the axisLength variable declaration in our script, let's declare two more variables that will determine how
far offset from 0 + 0i, or (0, 0), the center of the canvas will be:
    var aOffset = 0;
    var bOffset = 0;
Next, we will add this offset to our convert_coords function, so that each pixel is converted to a point that is offset by (aOffset, bOffset).
    function convert_coords([col, row]) {
        return [
           (col-(canvasWidth/2)) * (axisLength/canvasWidth) + aOffset,
           ((canvasHeight/2)-row) * (axisLength/canvasHeight) + bOffset
       ];
    }
After making these changes, let's set a few variables, save the script, and see how it looks in the browser.
    var axisLength = 1;
    var aOffset = -0.75;
    var bOffset = 0.25;
Using the values above, the center point of your canvas should shift to the left by 0.75, upward by 0.25, and zoom in x4
Try using other values for these three variables to see what parts of the set you can render.
Logging Mouse Clicks To the Console
Using variable declarations in the script to render different parts of the Mandelbrot set is not optimal.
It would be better to render different offsets and axisLengths based on where the user clicks the canvas.
onchange onclick onkeydown.
We will be using the mousedown event to capture the coordinates of clicks on our canvas using the following code:
    canvas.addEventListener('mousedown', function(e) {
        console.log([e.offsetX, e.offsetY]);
    });
After adding this to our script, we can click on the canvas a few times, and inspect the console to see the column and row (col, row) of every click on the canvas.
A Little Refactoring
When a user clicks on the canvas and the offset is changed, we will need to iterate over every pixel again, and redraw the Mandelbrot set. This means that our nested for loops
should be inside a function that we can call whenever we need it.
Let's name our function render_mandelbrot like in the code below, and call the function at the end of the script so that the set renders when the page first loads.
   function render_mandelbrot() {
       for(var row = 0; row < canvasHeight; row++) {
           for(var col = 0; col < canvasWidth; col++) {
               var x = convert_coords([col, row]);
               color_pixel(is_mandelbrot(x), [col, row]);
           }
           console.log(row/canvasHeight*100, '%');
       }
   }
   render_mandelbrot();
Redraw The Canvas When It Is Clicked
Let's change our event handler function so that instead of logging coordinates to the console, it will call the function zoom_canvas when it's clicked.
   canvas.addEventListener('mousedown', function(e) {
       zoom_canvas([e.offsetX, e.offsetY]);
   });
We'll also need to add a function named zoom_canvas that will change the offset variables depending on the coordinates of the click. zoom_canvas will also halve the axisLength variable to zoom in x2.
zoom_canvas changes the variables, it will clear the canvas and call render_mandelbrot to redraw the set using the new offset and axisLength values.
    function zoom_canvas(click_coords) {
        [aOffset, bOffset] =  convert_coords(click_coords);
        axisLength = axisLength / 2;
        ctx.clearRect(0, 0, canvasWidth, canvasHeight);
        render_mandelbrot();
    }
Witness The Power Of Our Fully Operational JavaScript
At this point, your code should look like the example below. Now we can save our script, refresh the browser, and click on the canvas to zoom in.
   <canvas id="mandelbrotCanvas"></canvas>
   <script>
       var iterations = 100;
       var canvasWidth = 400;
       var canvasHeight = 400;
       var axisLength = 4;
       var aOffset = 0;
       var bOffset = 0;

       var canvas = document.getElementById('mandelbrotCanvas');
       var ctx = canvas.getContext('2d');
       canvas.width = canvasWidth;
       canvas.height = canvasHeight;

       function square_val([a, b]) {
           return [a * a - b * b, 2 * a * b];
       }

       function abs_val([a, b]) {
           return Math.pow((Math.pow(a,2) + Math.pow(b,2)), 0.5);
       }

       function add_vals([a1, b1], [a2, b2]) {
           return [a1 + a2, b1 + b2];
       }

       function is_mandelbrot(z_sub0) {
           var z_subn = z_sub0;
           for(var n = 0; n < iterations && abs_val(z_subn) < 2 ; n++) {
               z_subn = add_vals(square_val(z_subn), z_sub0);
           }
           return n;
       }

       function convert_coords([col, row]) {
           return [
              (col-(canvasWidth/2)) * (axisLength/canvasWidth) + aOffset,
              ((canvasHeight/2)-row) * (axisLength/canvasHeight) + bOffset
          ];
       }

       function color_pixel(n, [col, row]) {
           if( n != iterations ) {
               var iterationPercent = n / iterations * 100;
               ctx.fillStyle = 'hsla(240, 100%, ' + iterationPercent + '%, 1)';
               ctx.fillRect(col, row, 1, 1);
           }
       }

       function render_mandelbrot() {
           for(var row = 0; row < canvasHeight; row++) {
               for(var col = 0; col < canvasWidth; col++) {
                   var x = convert_coords([col, row]);
                   color_pixel(is_mandelbrot(x), [col, row]);
               }
               console.log(row/canvasHeight*100, '%');
           }
       }

       function zoom_canvas(click_coords) {
           [aOffset, bOffset] =  convert_coords(click_coords);
           axisLength = axisLength / 2;
           ctx.clearRect(0, 0, canvasWidth, canvasHeight);
           render_mandelbrot();
       }

       canvas.addEventListener('mousedown', function(e) {
           zoom_canvas([e.offsetX, e.offsetY]);
       });

       render_mandelbrot();
   </script>
© alchemy.pub 2022 BTC: bc1qxwp3hamkrwp6txtjkavcsnak9dkj46nfm9vmef
Introduction
- Set Up Your Development Environment
- A Note On Complex Numbers
- Plotting Complex Numbers
- What is the Mandelbrot set?
- What Does That Mean?
- Evaluating The Sequence
- That Sounds Like A Game Of Battleship
- Let's See An Example
- Visual Examples
JavaScript
Complex Numbers
- What About Complex Numbers?
- Squaring Complex Numbers
- Calulating Absolute Values
- Summing Complex Numbers
- Testing The Script
Parameters
Rendering
- Adding The HTML Canvas Element
- Using JavaScript To Change The HTML Canvas
- Where Is The Origin?
- Converting Coordinates
- Iterating Over Each Pixel
- Rendering The Mandelbrot Set
- Adding Color